03 Mar New Insights into Tourism’s Contribution to State Economies

Tourism
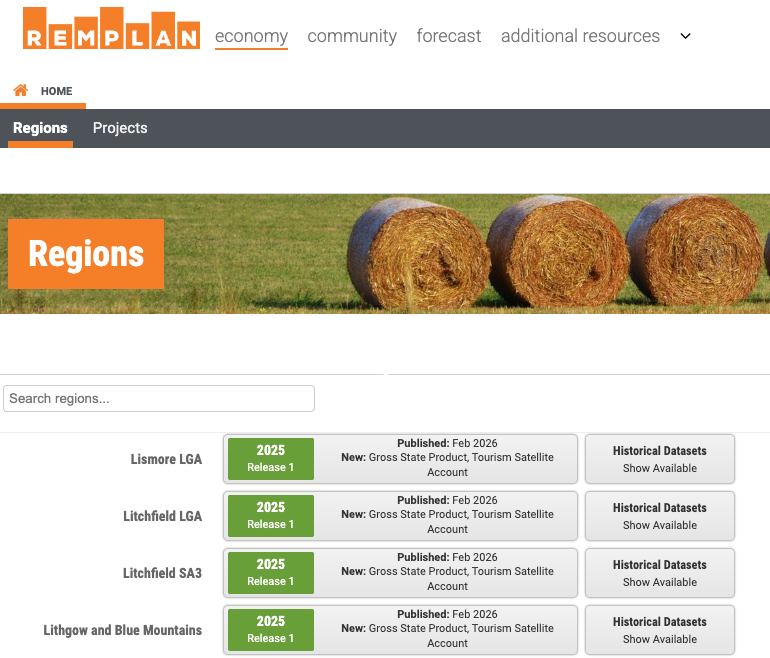
The 2025 REMPLAN Economy datasets incorporate the latest insights from the ABS 2024/2025 Tourism Satellite Account (TSA). Tourism estimates are available for states, regions and local government areas across Australia, and REMPLAN Economy software features economic impact modelling for tourism events, festivals and peak seasons.
The TSA report is produced by the Australian Bureau of Statistics (ABS), and it measures the size and economic value of tourism in Australia.
Why does the ABS publish the TSA?
Tourism isn’t a single clear-cut industry like mining or agriculture. It includes parts of many industries, such as hotels, airlines, cafes, tour operators, and retail stores. So it’s hard to see the exact contributions of tourism from standard economic data. The TSA addresses this problem.
The TSA sits alongside Australia’s main economic accounts, like Gross State Product (GSP) and Gross Domestic Product (GDP). It ‘zooms in’ on tourism and reorganises existing data to show:
- How much money visitors spend
- How much tourism contributes to Australia’s GDP
- How many jobs tourism supports
- Which industries benefit most from tourism.
Why it matters
Governments, businesses, and researchers use the Tourism Satellite Account to:
- Understand how important tourism is to the Australian economy
- Make policy and funding decisions
- Track recovery after events like COVID-19 or natural disasters
- Compare tourism’s size to other industries.
Gross State Product
The ABS Gross State Product (GSP) estimates show how much each Australian state and territory contributes to the national economy. GSP is a state-level version of Gross Domestic Product (GDP).
- GDP measures the total value of goods and services produced across all of Australia
- GSP measures the total value of goods and services produced within an individual state or territory.
In simple terms, GSP answers the question: “How big is each state’s economy?”
GSP measures the value added by businesses and industries:
- Goods produced (e.g. mining, farming, manufacturing)
- Services delivered (e.g. healthcare, education, tourism, finance)
- Government services.
Why it matters
The ABS publishes GSP estimates so governments, businesses, investors, and researchers can:
- Compare the economic performance of states and territories
- See which industries are driving growth in each state
- Track economic changes over time
- Inform policy and investment decisions.
2024-25 % Change
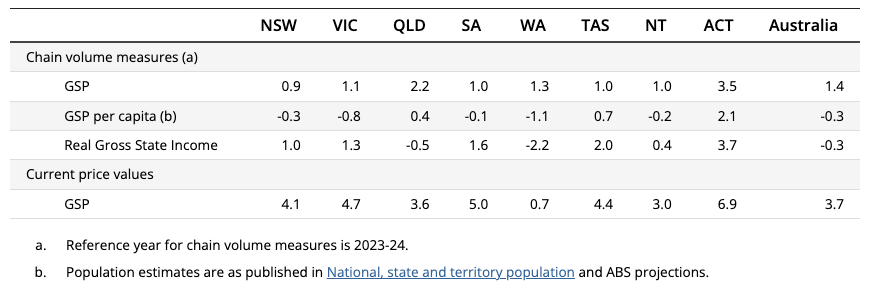
(Source: ABS National Accounts: State Accounts)
The 2025 GSP and 2024/2025 TSA data and insights from the ABS are incorporated into your latest REMPLAN Economy datasets:
Questions? Like to arrange a demo? Schedule refresher training?
Please contact the REMPLAN Team
1300 737 443
Contact us

No Comments