05 Dec Economic Productivity – REMPLAN Data Update
Understanding productivity is key to understanding economic growth and competitiveness.

How productive is your local economy?
Economic productivity measures output (gross revenue) relative to labour, capital or any other resource. It is typically calculated for the economy in its entirety, as ratios of gross domestic product (GDP) to employment and to hours worked.
Labour productivity may be further broken down by sector to examine trends in labour growth, wage levels, education and experience of the workforce, supply chain logistics and technological improvement.
Industries’ and regions’ productivity is a key factor in attracting investment and creating jobs.
When industry sectors fail to be productive, the potential for economic growth is restricted. Wages and salaries and output generated by businesses, together with living standards are also restricted. Lower levels of gross revenue may result in lower levels of investment, and in turn, lower levels of productivity resulting in a downward spiral.
Labour productivity is a challenge for Australia.
According to The Guardian, “Since 1978, Australia’s GDP has grown each year on a per capita basis by an average of 1.7%. However, over the past three years we have averaged less than half of that, at 0.8%.”
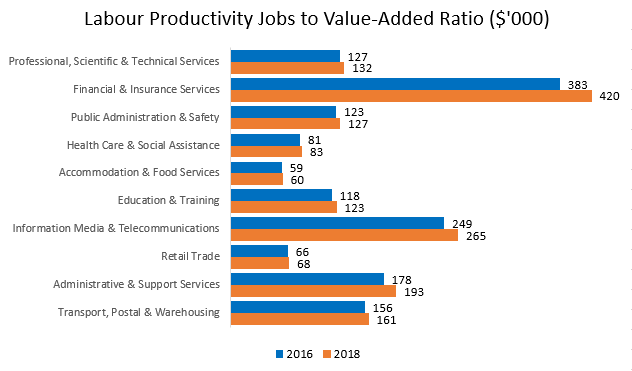
Using REMPLAN economic analysis software and data at a local level, specifically jobs to value-added ratios by industry sector, we can gain insights into how productivity in our local economies is changing over time.
Below is an example for the City of Melbourne:
REMPLAN subscribers may have noticed a new data update (2018 release 2). This data update incorporates the new 2016/2017 National Input-Output (I-O) tables from the Australian Bureau of Statistics (ABS) which provides valuable insights into the productivity of workers, updating estimates of output, wages and salaries and value added.
The tables also deliver detailed information about the supply and use of products in the Australian economy and insights into supply chain linkages. Consequently, all industry-specific and region-specific economic multipliers (which measure flow on impacts of economic activity) in the latest REMPLAN datasets have been updated.
How does the productivity of industry sectors in your local economy compare?
It is important to take the economic context into account when considering productivity. For each industry sector in your local economy, a ratio of jobs to value-added is a good starting point.
Subscribers to REMPLAN Economy (software and public profiles) receive the updated datasets at no additional cost: www.remplanlogin.com.au/economy.

Not a REMPLAN subscriber? We are available to discuss your potential requirements, please contact us.
REMPLAN also publishes public access Economy Profiles. Explore data for your local economy and other regions.

The team at REMPLAN are here to respond to any questions regarding the latest economic data for your region. We are available to provide REMPLAN training and management briefings on your area’s economy, and to discuss analysis to support your projects and funding submissions.
Let’s Talk: 1300 737 443
Kind regards,
The REMPLAN team

No Comments