20 Apr REMPLAN Data Update – Insights from the latest Business Counts Data
We are pleased to advise you that all public-access REMPLAN Economy and Community profiles have now been updated with the latest area-specific Counts of Australian Businesses (June 2015 to June 2019). This data has recently been released by the Australian Bureau of Statistics (ABS).
At June 30 2019, there were 2,375,753 actively trading businesses in the Australian economy, an increase of 2.7% (62,462 businesses) from June 30 2018. During this period, there was a 15.4% entry rate (355,722 entries) and a 12.7% exit rate (293,260 exits).
Business entries and exits, 2015-16 to 2018-19, Australia
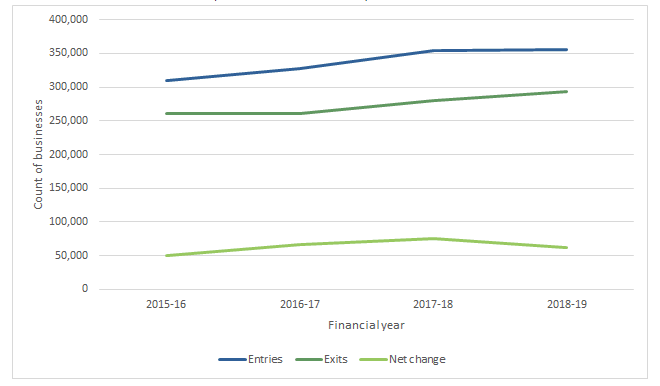
Source: Australian Bureau of Statistics
Click here to view an interactive map of business counts data at the Local Government Area (LGA) and Statistical Area 2 (SA2) geographic level.
Below are key findings from the Australian Bureau of Statistics:
Industry
‘Three industries accounted for more than half of total annual growth in businesses, these were:
- Construction
- Transport, postal and warehousing
- Professional, scientific and technical services’
In 2018-19 the Construction industry had a 2.4% increase in the number of businesses, with an increase of 9,302 to 394,575. This sector had the largest number of business counts across all industries. In 2018-19 this industry accounted for 16.6% of all businesses.
The Transport, postal and warehousing industry had a 7.7% increase in the number of businesses, the largest of any industry, with an increase of 13,505 to 189,982 total. In 2018-19 this industry accounted for 8.0% of all businesses.
The Professional, scientific and technical services industry had a 3.4% increase in the number of businesses, with an increase of 9,797 to 294,471 total. In 2018-19 this industry accounted for 12.39% of all businesses.
States and territories
‘In 2018-19 there was a:
- 5.2% increase in the number of businesses in the ACT, the largest of any state/territory, with an increase of 1,488 to 30,051 total.
- 3.6% increase in the number of businesses in Victoria, with an increase of 22,527 to 640,736 total.
- 1.0% increase in the number of businesses in Western Australia, the lowest of any state, with an increase of 2,363 to 232,967 total.’
Annual percent change in businesses by Main State, 2018-19
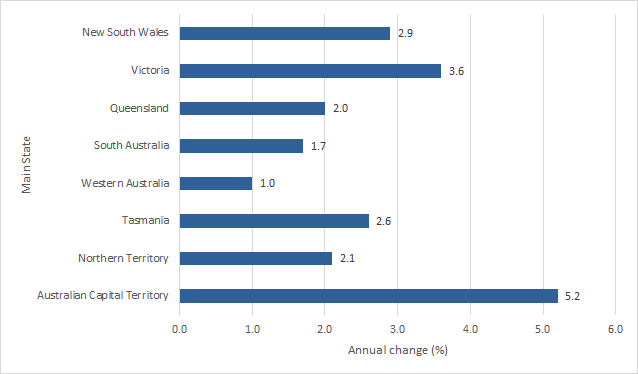
Source: Australian Bureau of Statistics
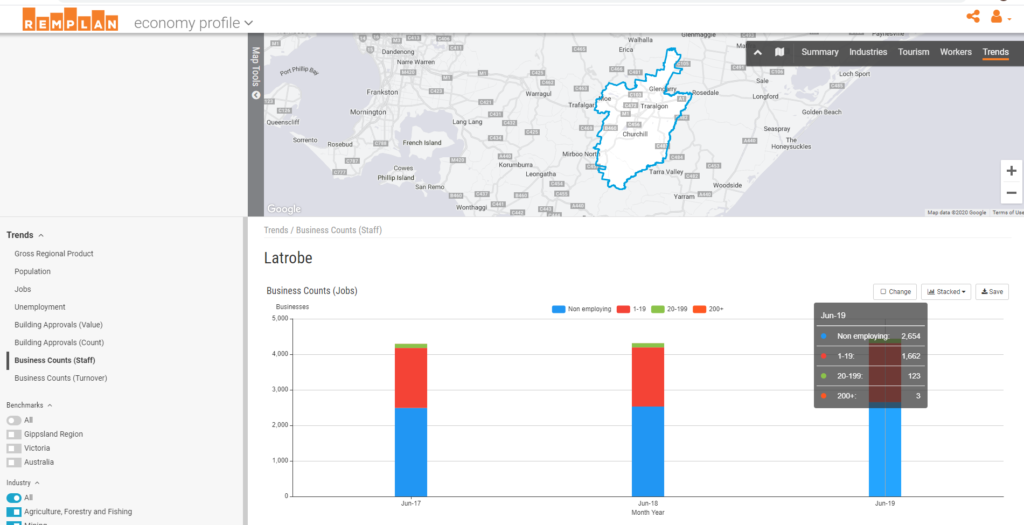
Click here to see the latest business counts data for your region, via your public economy and community profiles. This includes further details regarding employment size and turnover size of businesses.
The example below is for Latrobe City, VIC:
The next issue of the ABS’ Australian Businesses, Entries and Exits (June 2016 – June 2020) is expected to be released in December 2020. We anticipate that this release will reflect the impacts on Australian businesses of COVID-19.
In the interim we can gain some insights from the recent ABS survey:
‘Business Indicators, Business Impacts of COVID-19, Week Commencing 30 March 2020’
…which has found that ‘Of the 10% of businesses which reported that they were not trading, 70% reported that this was due to COVID-19.’
The ABS advises that this publication will be released once a month with results provided at the national level.
We have also undertaken some analysis of new ABN registrations in the first three months of this year and our blog article published on 7th April 2020 concludes that new business formation is significantly lower in the first quarter of 2020 compared to previous years. For further information, see Business Start Ups during COVID-19 .
Please contact the team at REMPLAN if you have any questions regarding this update. We are also available to provide REMPLAN software training, presentations and management briefings.
Let’s Talk: 1300 737 443.
Kind Regards,
The REMPLAN team

No Comments