18 Mar REMPLAN Data Update – Actively trading businesses, June 2020
Authored by Neil McNish
The Australian Bureau of Statistics (ABS) have recently released their annual estimates of actively trading businesses in Australia as at 30 June 2020. This period ended approximately 4 months after the World Health Organisation characterised COVID-19 as a pandemic and its impact began to be seen in Australia.
All public-access REMPLAN Economy and Community profiles have now been updated with the latest area-specific Counts of Australian Businesses (June 2018 to June 2020).
These estimates indicate that at the end of June last year there was a total of 2.422 million actively trading businesses in Australia, an increase of 2.0% or 46,651 businesses from the year before. This can be contrasted with the year to 30 June 2019 where business numbers climbed by 2.7%, which itself was a smaller increase than the year before.
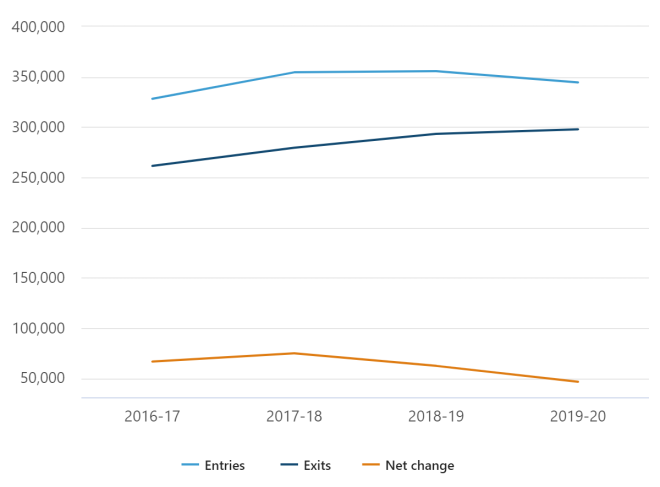
The graph below illustrates how business entries have been trending downwards over the past two years, while exits have continued on an upward trajectory:
Business entries and exits, 2016-17 to 2019-20, Australia
Industry sectors
Based on business numbers at the start of the year, overall, in 2019-2020 Australia has seen a business entry rate of 14.5% and an exit rate of 12.5% with the strongest performing industries being:
- Transport, postal & warehousing – 5.5% net increase
- Health care & social assistance – 5.0% net increase
- Professional, scientific & technical services – 2.5% net increase
And those experiencing a contraction in business numbers were:
- Agriculture, forestry & fishing – 1.0% net reduction
- Mining – 0.9% net reduction
- Information, media & telecommunications – 0.5% net reduction
States and Territories
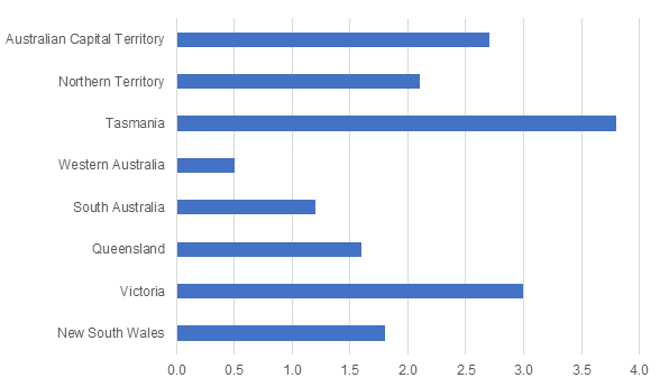
All state and territories have seen increases in their business counts but this has not been uniform across the nation. Tasmania has experienced the largest percentage increase of 3.8% and Western Australia has had the lowest increase of just 0.5%.
Percentage increase in business numbers 2019-2020
Business size
With regard to employment, the ABS analysis confirms that across Australia most businesses are small or very small:
- 63.9% of businesses are non-employing
- 24.8% employ between 1 – 4
- 8.8% employ between 5 – 19
- 2.3% employ between 20 – 199
- 0.2% employ over 200
And when we examine turnover size, we can see a similar trend:
- 28.4% of businesses have annual turnover between 0 – $50k
- 32.1% have turnover of $50k – $200k
- 32.5% have turnover of $200k – $2m
- 4.0% have a turnover of $2m $5m
- 1.4% have a turnover of $5m – $10m
- 1.6% have a turnover of over $10m
Impact of COVID-19 on business formation
In addition to the annual business counts explored above, the ABS have released some experimental estimates for two quarters, May 2020 and August 2020 providing some insights into the impact of the COVID-19 pandemic on business numbers.
Some of the key findings from this research paper indicate that in the May 2020 quarter, business entries were the lowest recorded over the last three years and down 9.0% on the same quarter in 2019. However, in the August 2020 quarter, business entries returned to levels consistent with the same time last year.
Further information can be found on the ABS website.
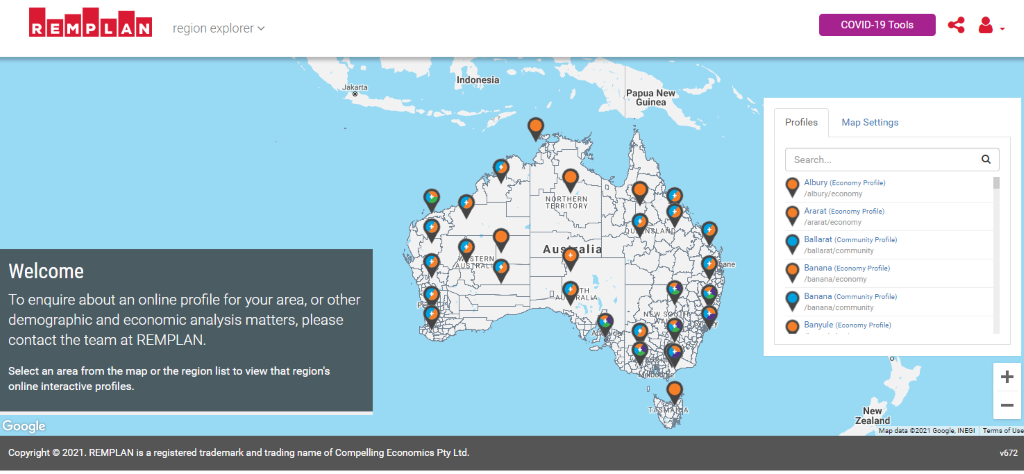
Our clients’ public regional profiles have now been updated with the latest business count data and these can be viewed by searching our Region Explorer application accessed on our Data Explorers page on the REMPLAN website.
See our Blog published on 10th March 2021 for further information on our range of free data explorers.
Please do not hesitate to contact the REMPLAN Team for further information or call us on 1300 737 443.

No Comments