11 May New Unemployment Explorer: How does your region compare?
The National Skills Commission has released its December 2020 quarterly unemployment estimates at the Statistical Area Level 2 (SA2) and Local Government Area (LGA) levels. This is a key set of figures, providing insights into how COVID-19 has impacted unemployment in small areas over the nine months from the start of restrictions being imposed in Australia.
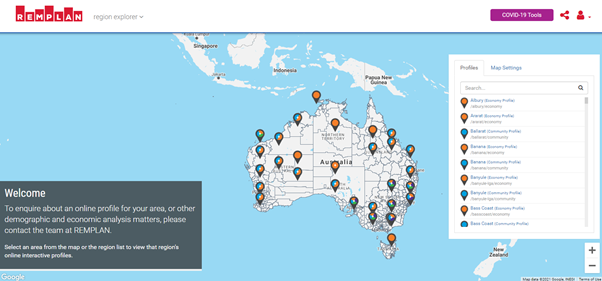
To assist with accessing Small Area Labour Market data, REMPLAN has developed an Unemployment Explorer as part of our series of free economic and demographic analysis tools available on our website. In line with our other explorers, this provides a spatial perspective on unemployment figures across Australia.

The Unemployment Explorer shows the latest official unemployment rate in every SA2 and LGA in Australia for which figures are provided. The change in unemployment rate from the previous quarter, shown in percentage points, is also included. Both these figures are benchmarked against all other equivalent areas in either Australia or the relevant State or Territory.
The National Skills Commission prepares the Small Area Labour Market estimates by smoothing a four-quarter average of the unsmoothed figures and therefore the December 2020 figures include a quarter prior to COVID. Nevertheless, the December figures do reflect the impacts on the labour market since the emergence of COVID-19.
The December 2020 quarter data shows that almost 80 percent of SA2s for which smoothed estimated are available recorded an increase in their unemployment rate. In this period, 40 percent of SA2s recorded an unemployment rate of less than 5.0 percent while 13.0 percent recorded an unemployment rate of 10.0 percent or more.
In March 2021, at the National level, the unemployment rate has fallen by 0.2 percentage points to 5.6 percent from the previous month. At the same time, the performance of the States and Territories has been more variable. New South Wales, Queensland, South Australia, Western Australia and the Australian Capital Territory have all experienced falls in the unemployment rate, with increases seen in Victoria, Tasmania and the Northern Territory. Unemployment is still highest in South Australia despite falling 0.5 percentage points from February, and is lowest in the Australian Capital Territory falling a further 0.6 percentage points in the month to 3.4 percent. Western Australia has seen the biggest drop in its unemployment rate of 1.3 percentage points.

Our clients’ public access online regional profiles have now been updated with these latest unemployment figures and these can be viewed by searching our Region Explorer application accessible via the Data Explorers page on the REMPLAN website.
For further information on our range of free data explorers see our blog published on 10th March 2021.
Questions? Seeking insights into the performance of your region’s economy?
Please do not hesitate to contact the REMPLAN Team, or call us now on 1300 737 443.

No Comments