28 Oct REMPLAN Impact Modelling Guide
Q: Which REMPLAN resource is used most frequently?
A: Economic Impact Modelling!
Economic impact modelling with REMPLAN
According to our system data, it is the Impacts tab in REMPLAN Economy that is the most frequently used resource across our software products.
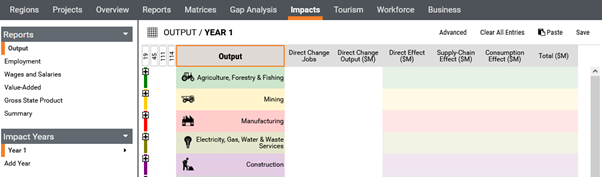
Under this tab users can model the economic impacts of projects and investments, large and small, to understand the likely direct and flow-on implications for the economy of the local area, the wider region and the state.
Economic impacts are presented in terms of employment, output, wages & salaries and gross regional product. Analysis provides valuable inputs into:
- grant funding applications
- business cases
- cost-benefit analysis
- assessment of development applications
- strategic planning.
REMPLAN Economy is used by many state and federal funding agencies to support their assessments of funding submissions.
Industry-to-industry transactions
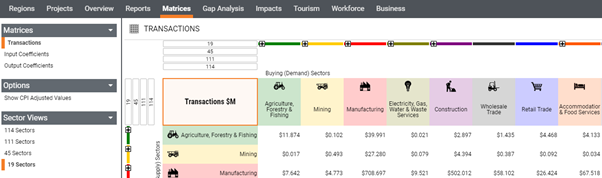
Enabling the impact modelling in REMPLAN are the matrices of region-specific, industry-to-industry buying and selling relationships. These transactions can be viewed and downloaded via the Matrices tab.
REMPLAN matrices incorporate various inputs from the Australian Bureau of Statistics (ABS) National Accounts, which are designed to provide a systematic summary of national economic activity and have been developed to assist in the practical application of economic theory.
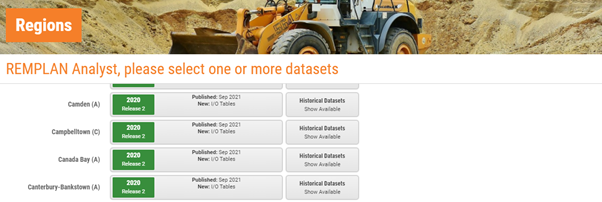
The Australian National Accounts Input-Output (I-O) tables are updated annually, with the 2018-2019 tables being released in 2021. The latest REMPLAN update ‘2020 Release 2’, incorporates these new tables.
I–O tables are part of the Australian national accounts, providing detailed information about the supply and use of products in the Australian economy and about the structure of, and inter–relationships between, 114 industry sectors. The following reports in REMPLAN Economy have been updated:
- Output
- Wages and Salaries
- Local Sales / Expenditure
- Regional Exports / Imports
- Value-added.
REMPLAN datasets are updated following releases from the ABS and users are able to continue to access their superseded ‘Historical Datasets’ for benchmarking and trend analysis.
Within REMPLAN economic models, the I-O tables define the region-specific buying and selling interactions between industry sectors. This reconciliation between the demand-side (buying) and supply-side (selling) of a local economy is the basis upon which REMPLAN’s region-specific economic multipliers are calculated.
The I-O tables, and the Impacts tab interface in REMPLAN Economy, allow the modelling of flow-on economic impacts from an actual or hypothetical direct changes. Impact scenarios can be entered as positive or negative changes to direct jobs, or to direct output for each industry sector.
REMPLAN Economy automatically calculates the flow-on supply-chain effects and consumption effects for your direct changes. The flow-on impacts for the region’s economy from a direct change are summarised as region-specific economic multipliers.
How can I model economic impacts using REMPLAN?
Examples scenarios
What will the likely impacts be for our local economy of an investment or an increase in employment?
How does my business contribute to our local economy?
How will an industry closure in our region affect other industry sectors in the area?
These are just some of the questions which can be addressed via the Impacts tab in REMPLAN Economy. Under this tab users can model the flow-on economic impacts of a direct change to jobs or output in the local economy.
For actual or hypothetical economic changes in a region, REMPLAN Economy users can assess the likely direct and flow-on implications across industry sectors in terms of:
- Output
- Employment
- Wages and Salaries
- Value-added / Gross Regional Product (GRP).
Economic impact modelling guide
There are a number of general principles that should be followed when undertaking economic impact analysis and the following provides an overview of how to prepare scenarios for application to the Impact tab in REMPLAN Economy.
Step 1- Define your project
Defining your project sets the ‘scenario’ for impact modelling. This typically consists of the initial short-term investment / capital expenditure / construction phase of the project.
- How much is the investment expected to cost?
- What will the expenditure be on?
- Over how many years will the expenditure occur?
Next, consider the subsequent operational phase of the project:
- What has changed following the investment phase?
- Will any new jobs be created? Ongoing employment supported? In which industry sectors?
- Will ongoing direct economic output be generated? In which industry sectors?
- Will the direct ongoing impacts in terms of output and employment occur within the first year post investment, or ramp up over several years?
Step 2 – Select the regions for analysis
When selecting regions for impact modelling, consider who the audiences for your analysis are. They may be local, state, or federal government agencies, private sector companies, or service providers.
Select regions that are best aligned with the interests of your audiences.
Align the impact scenarios in step 1 with the regions you have identified under step 2. The direct impacts should reflect the marginal benefits for the selected regions and should exclude any economic activity that is already occurring.
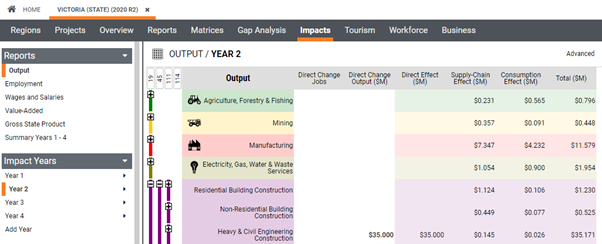
Step 3 – Project timeframe
Structure economic impact scenarios on a year-by-year basis (where applicable) for consistency with ABS National Accounts data in REMPLAN that reflects economic activity for 12-month periods.
For example, an expansion of a manufacturing facility may require multiple years to plan and construct, and then operate for many more. For example:
Year 1 – Planning and design
Year 2 – Site preparation
Year 3 – Building construction
Year 4 (+) – Operational phase
The operational phase may ramp, and then continue for many years into the future in line with the life of the asset, market conditions, and other applicable factors.
Step 4 – Impact modelling
Before entering your scenario into the impacts table, consider if some of the expenditure is likely to be on goods and services imported into the region. For example, a project in a region may require expenditure on architectural services not available locally. This ‘leakage’ should be excluded from the analysis when assessing the likely economic benefits for the selected region.
Apply the region-specific direct change scenarios of output and/or employment for the relevant year, to the closest corresponding industry sector(s) in the REMPLAN Impacts tab. For example, a manufacturing project may include:
Year 1 – Planning and design (e.g., Prof., Scientific & Technical Serv.)
Year 2 – Site preparation (e.g., Heavy & Civil Engineering Construction)
Year 3 – Building construction (e.g., Non-Residential Building Const.)
Year 4 (+) – Operational phase (e.g., Food Product Manufacturing).
It should be noted that placing all expenditure into one year will cause the impacts tool to over-estimate the employment impacts for the project.
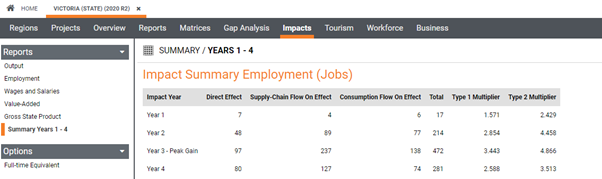
Step 5 – Reporting Results
The final step is to summarise your economic impact analysis in terms of:
- Scenario
- Region
- Year
- Impacts Type (output, employment, wages & salaries, value-added / GRP/ GSP)
For output, wages & salaries, and value-added / GRP / GSP, impacts across multiple years may be totalled, if the project timeframe is also reported. For example:
…total output over the 4-year project period is estimated at $_______ million.
For employment, however, report the year in which employment peaks rather than as a total across multiple years. This is due to employment levels fluctuating in line with the stages of the project. A job in year one does not necessarily continue into year two. Even when a job does continue into year 2, it remains the same job and does not represent additional employment.
We hope that the above will be a useful guide when undertaking economic impact analysis to support your projects. Assistance is also available from the REMPLAN team as required.
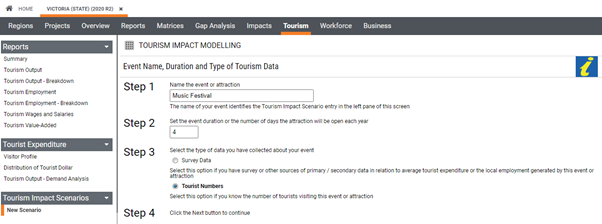
And there’s more…
REMPLAN Economy also has the ability to model the impacts of tourism activity in a selected region via the Tourism tab.
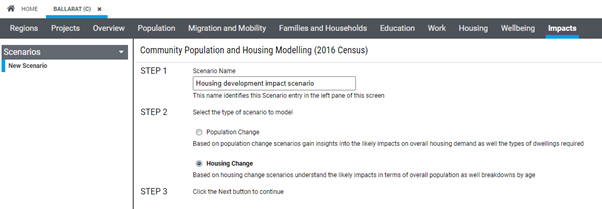
In REMPLAN Community, the demographics counterpart to REMPLAN Economy, impact modelling can be undertaken in relation to population and housing scenarios. The modelling provides insights into the likely economic implications of changes to local housing provision, and population levels.
For further information on our complete range of products and services, or any of the above impact modelling tools, please contact the REMPLAN team on on 1300 737 443 or arrange an online refresher training session or demonstration.
Kind Regards,
The REMPLAN team
www.remplan.com.au

No Comments