06 Jul A decade of population change – REMPLAN ERP Explorer update
What parts of Australia have seen the greatest amount of population change over the last decade? REMPLAN’s ERP Explorer, one of the free explorers accessible on our Data Explorers webpage, has been updated to include the latest estimated residential population figures for LGAs produced by the ABS and this allows users to look at how their local area has changed over last ten years. How did your area change in the ten years to 2020?
The map below shows the volume of population change in LGAs across the country between 2010 and 2020. Darker shades of purple and black indicate significant growth. The spatial pattern clearly shows that parts of Australia’s largest cities have recorded significant growth. Four LGAs recorded growth of more than 100,000 persons over the ten years, headed by Brisbane City Council (199,855). This was followed by Gold Coast (129,065), Wyndham (128,043) and Casey (110,129). This volume of growth presents significant planning challenges for local government, particularly with regard to service provision in new housing developments.
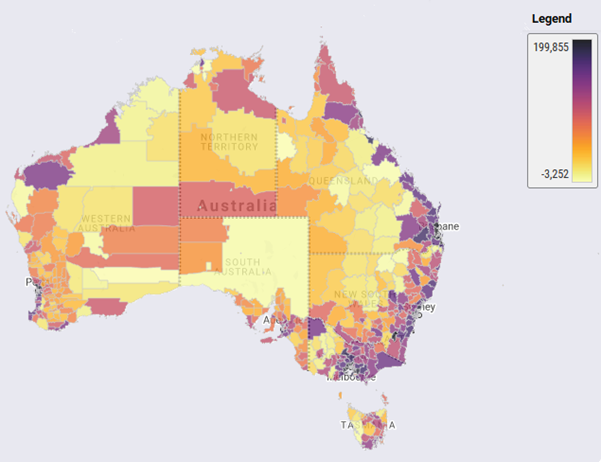
However, dealing with issues arising from population change also occurs at the other end of the scale. Almost 31% of Australia’s LGAs recorded population decline between 2010 and 2020. The challenges associated with population decline are just as pressing for local government as those dealing with rapid population growth. Between 2010 and 2020, the outback Queensland mining community of Mt Isa recorded the largest volume of population loss of all LGAs in Australia (-3,252 persons). This amounts to a 15% decline over the ten years. Kalgoorlie-Boulder (-2,695) and Broken Hill (-1,998) also recorded significant population decline over this period.
It’s no coincidence that Brisbane City Council recorded the largest volume of growth as it reflects the already large population – the 2020 ERP was 1.27 million. In a previous blog we mentioned that the volume of change represents one aspect of population change, but the percentage change shows another. The map below shows the annualised growth rate over the period 2010-2020. This map also shows the strong growth rates recorded in Australia’s largest cities, but also highlights other areas that have grown rapidly.
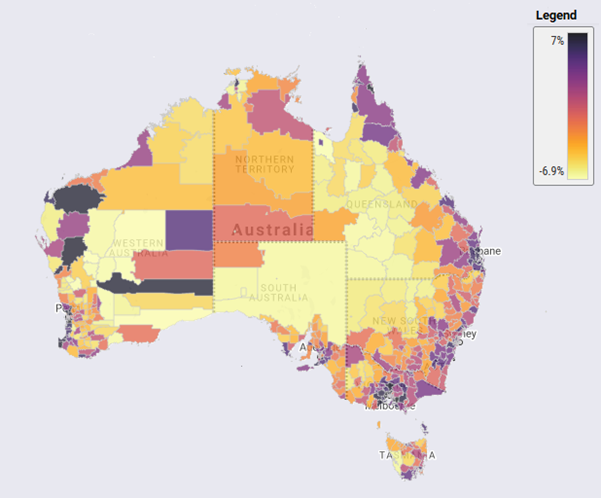
Serpentine-Jarrahdale, located on Perth’s southern outskirts, recorded the strongest annualised growth rate between 2010 and 2020 (7.0%). This rate of growth meant that the population almost doubled over the ten years. There are a number of greenfield developments located in this LGA, particularly around the town of Byford. This area will continue to grow into the future as Perth’s metropolitan area continues to expand southwards.
Overall, LGAs on the urban fringe in Perth and Melbourne recorded the strongest annualised growth rates. This reflects a decade of strong growth in both cities. In addition, their CBDs also grew strongly, the City of Melbourne recording an annualised growth rate of 6.5%, and the City of Perth (4.1%). Camden Council, located on Sydney’s south western outskirts, was the lone NSW entrant amongst the fastest growing LGAs (6.6%).
LGAs where the annualised growth rate showed rapid decline tended to be small in size. The Shire of Cue in WA’s mid-west recorded annualised growth rate of -6.9%. In contrast to Serpentine-Jarrahdale, this meant the population halved over the ten years, from 287 in 2010 to 140 in 2020. Other small and remote LGAs in WA also declined rapidly over the ten years, including Dundas (-4.8%), Wiluna (-4.6%) and Leonora (-4.5%). Population growth and decline in many parts of Western Australia is contingent on activity in the mining and resources sector.
How does population change in your area compare with others? Select an area by zooming in or typing the LGA name into the search bar. The ERP Explorer also shows data for SA2s across Australia, which shows a more fine-grained spatial aspect to the data.
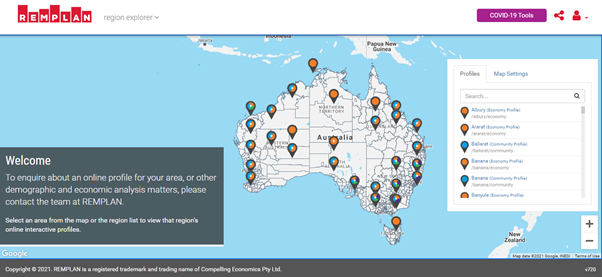
Our clients’ public profiles have also been updated with the latest ERP data and these can be viewed by searching our Region Explorer application accessed on our Data Explorers page on the REMPLAN website.
For further information contact the REMPLAN team or call us on 1300 737 443.

No Comments