03 Mar What is the population of our area? REMPLAN’s ERP Explorer answers that critical question
Authored by Simone Alexander
When I worked in local government, one of the questions I was asked the most was “what is the population?”. It’s a key indicator of change in a community, and is a critical input for service planning, but many people don’t know how to access this data.
REMPLAN’s ERP Explorer changes this. It’s a new, free tool that provides a quick and easy way to find the population of local government areas (LGAs) and SA2s in Australia. The Explorer includes the latest Estimated Resident Population (ERP) data from the ABS, as well as the equivalent figure from ten years prior. Currently, the Explorer has data for 2009 and 2019, as well as the change in population and the annualised growth rate over the ten years. Both measures are important as indicators of change – one determines how many people you need to plan services for, the other how quickly you need to do this.
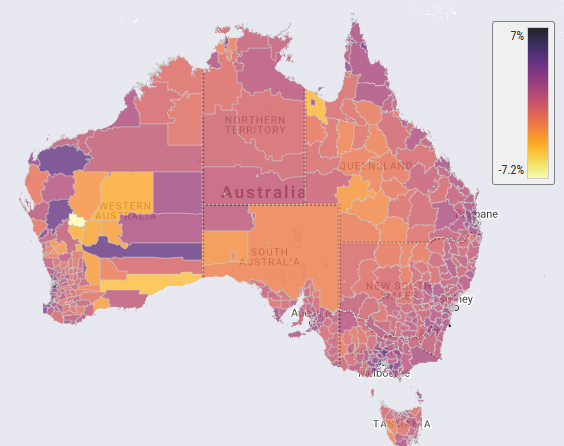
In addition, the Explorer places this data in a spatial context. The map below shows the annualised growth rate of all LGAs in Australia over the period 2009-2019. It’s a dynamic map, so you can zoom in on particular regions, or click on an LGA for more information. Zooming in on this map shows that many LGAs on the edges of our major cities recorded very strong growth rates over the ten years.
The Explorer also enables you to compare the rate and volume of growth in your area, and compare it to surrounding areas. It also provides a ranking both Australia wide, or for your state or territory of interest.
For instance, the City of Greater Bendigo had a population of 99,003 in 2009, and this grew to reach 118,093 in 2019. The total increase was 19,090 persons, or 19.3%. This equates to an annualised increase of 1.8% over the ten years.
The total increase of 19,090 persons means that the City of Greater Bendigo ranks 57th out of 543 LGAs across Australia, whereas the annualised growth rate of 1.8% ranks 87th (see below).
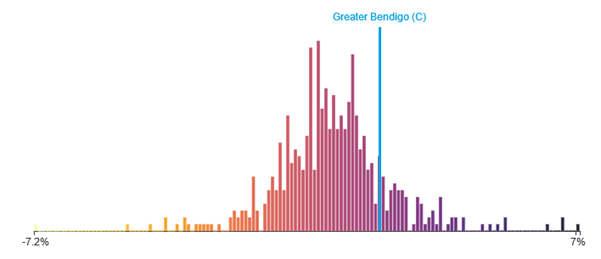
But there’s so much more. This chart is dynamic, so when you click on the bars it will tell you what areas are represented. Greater Bendigo’s annualised growth rate of 1.8% was shared by a number of other LGAs, including Ballarat, Stonnington, Cessnock and Alexandrina.
The chart also shows that the highest and lowest annualised growth rates between 2009 and 2019 were both recorded in Western Australia. The highest was recorded by the Shire of Serpentine-Jarrahdale, a rapidly developing areas on the southern outskirts of Perth. This LGA almost doubled in population, from 16,487 in 2009, to 32,562 in 2019. This represents an annualised growth rate of 7% per annum on average. At the other end of the scale, the small LGA of Cue recorded an annualised growth rate of -7.2% per annum. Located in Western Australia’s Mid-West region, in 2009 the population was 303, but had declined to 143 by 2019.
As mentioned above, it’s important to consider both the volume and rate of change. Your region of interest might record a high volume of population change, but is it the strongest growth rate? Brisbane City Council recorded total growth of 196,290 over ten years, but this represented an annualised growth rate of 1.7%. Second ranked Wyndham, located in Melbourne’s west, recorded total growth of 127,082, or 6.6% per annum. Its smaller population and rapidly growing new suburbs meant that the population almost doubled in ten years. Only three LGAs, all of which are located in Victoria, appear in both the top ten lists of population growth, and annualised growth rate.
LGAs with the highest total growth, 2009-2019
| Rank | LGA name | State | Population 2009 | Population 2019 | Total growth (no.) | Annualised growth rate (%) |
|---|---|---|---|---|---|---|
| 1. | Brisbane | Queensland | 1,057,692 | 1,253,982 | 196,290 | 1.7% |
| 2. | Wyndham | Victoria | 143,405 | 270,487 | 127,082 | 6.6% |
| 3. | Gold Coast | Queensland | 495,835 | 620,518 | 124,683 | 2.3% |
| 4. | Casey | Victoria | 246,678 | 353,872 | 107,194 | 3.7% |
| 5. | Moreton Bay | Queensland | 370,447 | 469,465 | 99,018 | 2.4% |
| 6. | Whittlesea | Victoria | 145,445 | 230,238 | 84,793 | 4.7% |
| 7. | Melbourne | Victoria | 94,247 | 178,955 | 84,708 | 6.6% |
| 8. | Blacktown | NSW | 299,450 | 374,451 | 75,001 | 2.3% |
| 9. | Sunshine Coast | Queensland | 258,047 | 328,428 | 70,381 | 2.4% |
| 10. | Sydney | NSW | 177,150 | 246,343 | 69,193 | 3.4% |
LGAs with the strongest annualised growth, 2009-2019
| Rank | LGA name | State | Population 2009 | Population 2019 | Total growth (no.) | Annualised growth rate (%) |
|---|---|---|---|---|---|---|
| 1. | Serpentine-Jarrahdale | Western Australia | 16,487 | 32,562 | 16,075 | 7.0% |
| 2. | Melbourne | Victoria | 94,247 | 178,955 | 84,708 | 6.6% |
| 3. | Wyndham | Victoria | 143,405 | 270,487 | 127,082 | 6.6% |
| 4. | Camden | NSW | 55,377 | 101,437 | 46,060 | 6.2% |
| 5. | Cardinia | Victoria | 67,899 | 112,159 | 44,270 | 5.1% |
| 6. | Melton | Victoria | 99,935 | 164,895 | 64,960 | 5.1% |
| 7. | Kwinana | Western Australia | 28,047 | 45,092 | 17,045 | 4.9% |
| 8. | Whittlesea | Victoria | 145,445 | 230,238 | 84,793 | 4.7% |
| 9. | Armadale | Western Australia | 58,508 | 90,797 | 32,289 | 4.5% |
| 10. | Menzies | Western Australia | 351 | 520 | 169 | 4.0% |
| 10. | Ashburton | Western Australia | 9,004 | 13,305 | 4,301 | 4.0% |
REMPLAN’s ERP Explorer can be accessed through the following link. It will be updated each year in line with the release of data from the ABS. REMPLAN uses this data across all our products, which are updated at the same time.
This new tool is the latest in a range of free Explorers, which can be accessed through the REMPLAN website. These include:
- detailed area profiles
- COVID-19 Economic Impacts and JobKeeper data
Let us know what you think! Contact the REMPLAN team on 1300 737 443.

REMPLAN | REMPLAN Data Explorers – free economic and demographic information | REMPLAN
Posted at 23:09h, 10 March[…] These free resources are regularly reviewed and updated and further Explorers are under development. For further information about the ERP Explorer, please refer to our recent blog. […]
REMPLAN | A decade of population change – REMPLAN ERP Explorer update | REMPLAN
Posted at 16:22h, 06 July[…] of growth as it reflects the already large population – the 2020 ERP was 1.27 million. In a previous blog we mentioned that the volume of change represents one aspect of population change, but the […]