17 Jan New Business Counts Data
Strong Growth for Construction, Professional Services and Health
The Australian Bureau of Statistics (ABS) has released its annual estimates of actively trading businesses in Australia at 30 June 2021. The data is available for the States and Territories, Local Government Areas and at Statistical Area 2 (SA2) level.
These estimates indicate that at the end of June 2021 there were a total of 2.402 million actively trading businesses in Australia, an increase of 3.8%, or 87,806, compared to the year before. This can be contrasted with the year to 30 June 2020 where business numbers increased by only 2%. During the year there were 365,480 new business entries and 277,672 business exits.
These figures have reversed the trend over the previous two years where the increase in business numbers has been less than the preceding year. The graph below illustrates this.
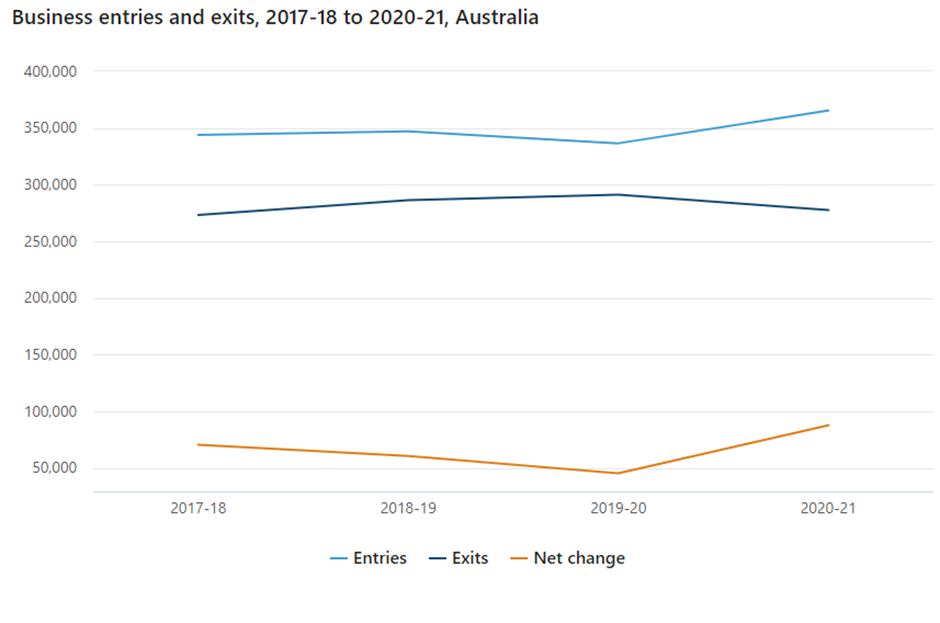
This is a remarkable result given the ongoing impacts of COVID-19 on the business community.
The three industries with the largest net increase in businesses during the year were:
- Construction (an increase of 16,603 to 410,839)
- Professional, Scientific & Technical Services (an increase of 14,432 to 316,362)
- Health Care & Social Assistance (an increase of 10,674 to 159,076)
In percentage terms, those industries with the largest growth in business numbers were:
- Other Services (+7.4% to 114,575)
- Health Care & Social Assistance (+7.2% to 159,076)
- Retail Trade (+6.3% to 145,079)
The industry with the largest percentage decrease in businesses to June 2021 was Transport, Postal & Warehousing with a reduction of -2.8% (5,589 businesses).
States and Territories
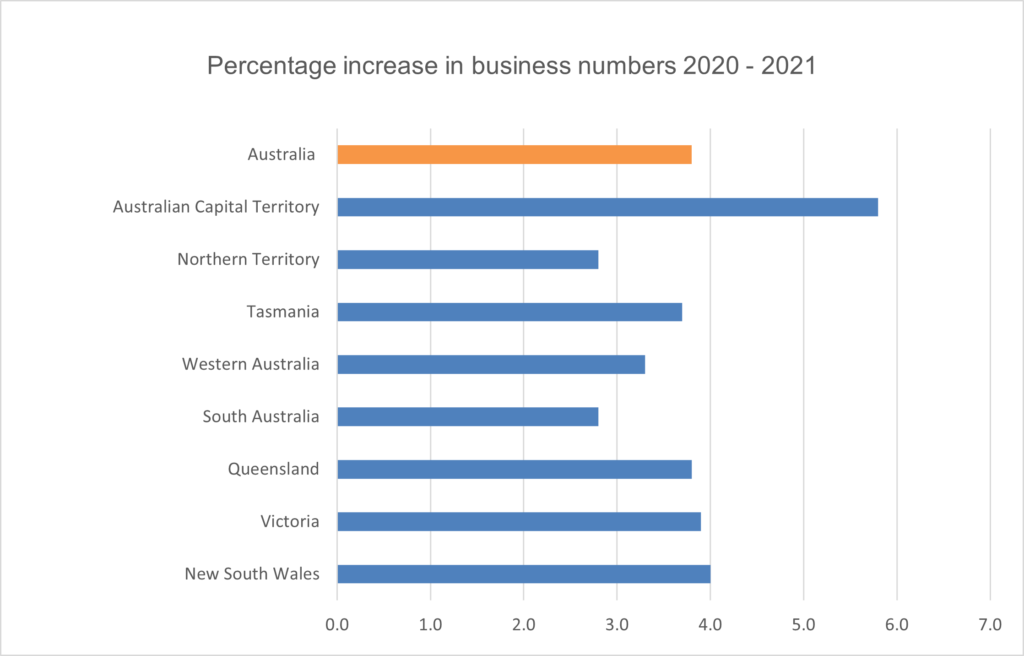
All state and territories have seen increases in their business numbers, but rates have varied across the nation. The Australian Capital Territory has experienced the largest percentage growth with an increase of 5.8% (1,732 businesses). New South Wales saw the next largest increase of 4.0% (31,245). The smallest increases in business numbers (2.8%) were seen in the Northern Territory (407) and South Australia (4,085).
Business size
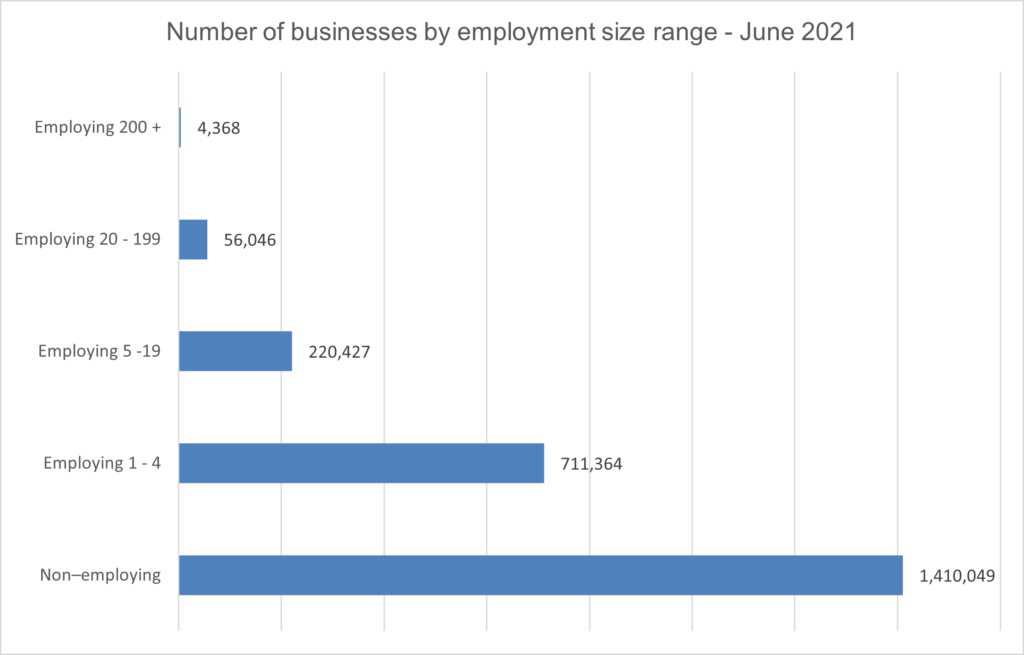
The ABS analysis confirms that across Australia the vast majority of businesses continue to be small or very small. Over 97% of businesses employ less than 20 people and have a turnover of less than $5 million.
From an employment perspective:
- 58.7% of businesses are non-employing
- 29.6% employ between 1 – 4
- 9.2% employ between 5 – 19
- 2.3% employ between 20 – 199
- 0.2% employ over 200
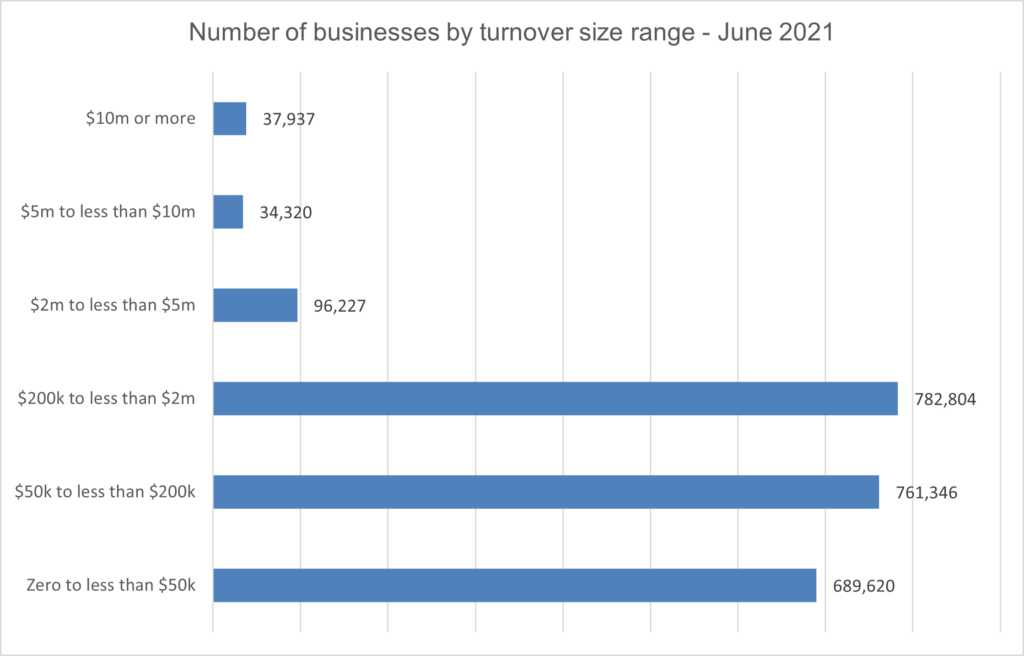
And when we examine turnover size, we can see a similar pattern:
- 28.7% of businesses have an annual turnover between 0 – $50k
- 31.7% have turnover between $50k – $200k
- 32.6% have turnover between $200k – $2m
- 4.0% have a turnover between $2m – $5m
- 1.4% have a turnover between $5m – $10m
- 1.6% have a turnover of over $10m
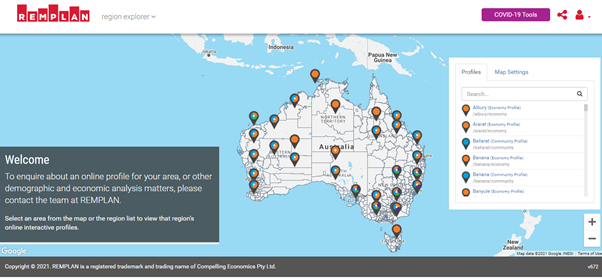
Our clients’ public regional profiles have now been updated with these latest business count estimates and they can be viewed by searching our Region Explorer application. More economic information can also be accessed on our Data Explorers page on the REMPLAN website.
Please contact the team at REMPLAN if you have any questions or would like to discuss how we can assist you with economic and demographic analysis matters more broadly.

No Comments